
Story of Interest
Written by Chadi Halahel
Option Pricer
This article is meant to serve as a tutorial on how to access the Option Pricer on the Reuters Eikon software to graph potential options strategies. It is important to remember that security prices are always changing and therefore the potential payoff of these strategies is also changing. Furthermore, no live trading is permitted when using Reuters Eikon software. This is strictly an educational guide on how to better understand the various strategies one can create using options, along with how their payoffs theoretically look like. Lastly, this guide assumes you understand the basics of what equity options are. For those who would like to learn more about the basics of options please visit https://www.investopedia.com/options-basics-tutorial-4583012. Using the software is a great way to better understand the various types of options strategies and how options are priced.
How to access the Option Pricer:
Step 1: Log into Reuters Eikon and select the Eikon symbol on the top left corner of the screen.
Step 2: Select “Analytics & Calcs” then select “Option Pricer”.
OR: Search for the Option Pricer using its function OPR in the search bar.
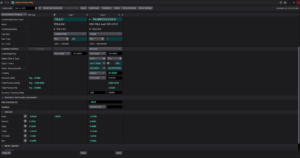
The Option Pricer should look like the screenshot below. Now, you can add multiple components to your trading strategies by adding “legs” (The plus sign next to “Leg 1/1”). You must input an underlying security in the “underlying/option code” area, along with the “leg type”.

Example:
Let us assume we want to go long on Tesla in the short to medium term. We are long 100 shares and want to limit our downside risk on such a large position. We can use a common options strategy known as a protective put to limit our downside risk. For every 100 shares, we must buy 1 put option at a specific strike price and date. In this scenario, I am planning on buying 100 shares of Tesla at $335.54 (Leg 1) and purchasing 1 put option at a strike price of $325 expiring January 17, 2020 for $18 (Total cost = price of contract * number of contracts * 100, $18 * 1 * 100 = $1,800).
The theoretical payoff and breakeven point of such a strategy can be shown by selecting the “Show Scenario” button on the top-right header of the calculator. Below is what the strategy may look like given the current inputs, ignoring commissions and liquidity risk.